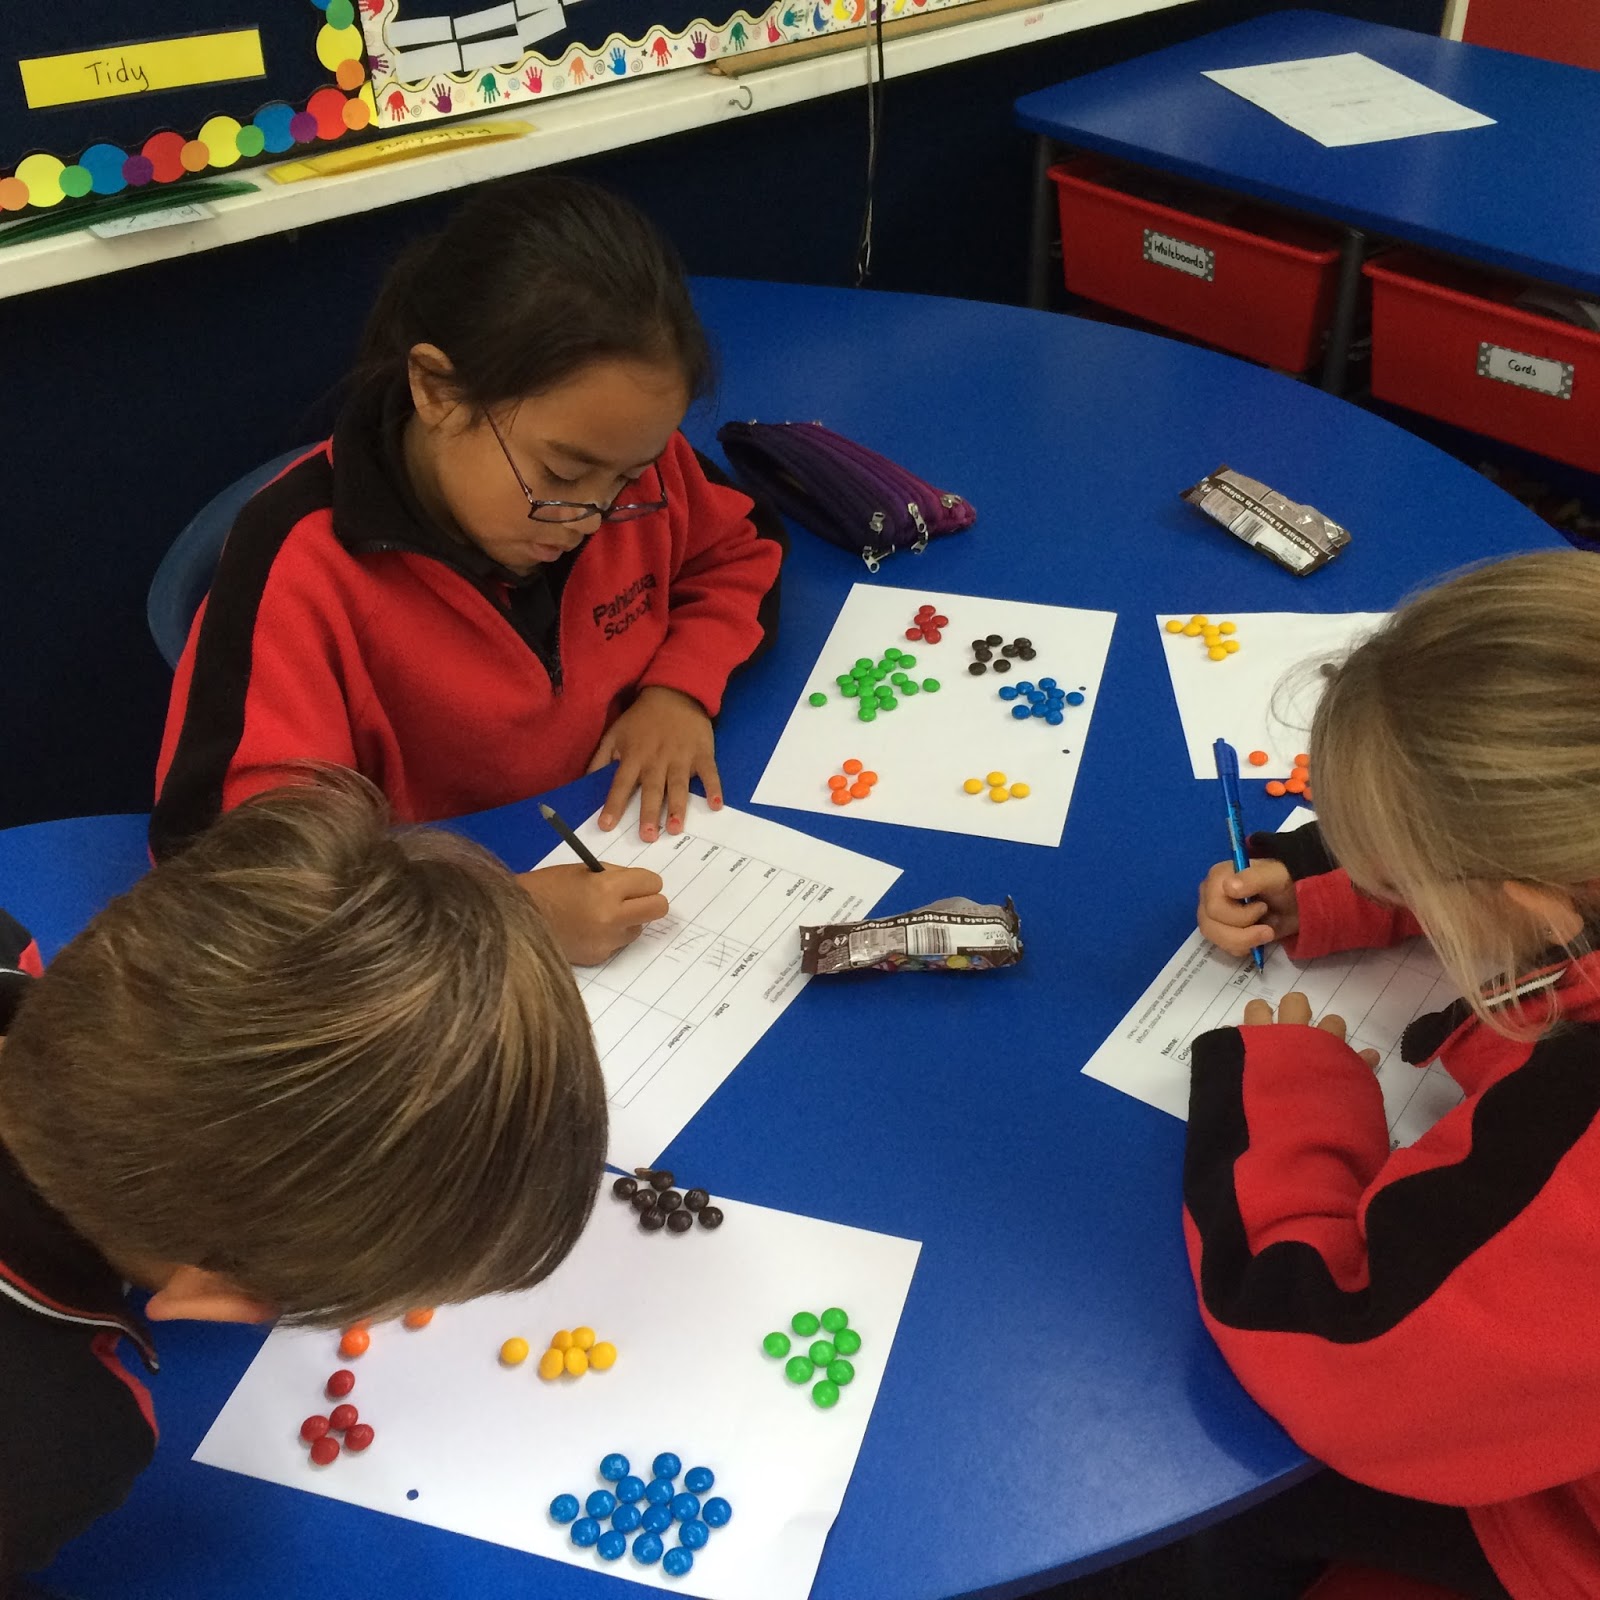
The students started by completing a tally chart with the amounts of each colour in the packet. This introduced some new learning around how to use tally marks and allowed us to practice our counting in 5s skills. And of course, once we had created out tally charts we got to eat the M&Ms!
Next we used the tally charts to create a pictograph. The class impressed me with their ability to use the tally charts to support them with their pictographs and they created some great results. We then used these pictographs to answer some questions and analyse the data. I believe it is important for the students to get equal experience in creating graphs and also in understanding what the graphs are showing them.


No comments:
Post a Comment